Functionality
Administration site
After configuring and activating the extension, a new menu item called ‘Analytics’ will appear under a section called ‘Services’.
User site
When the user logs into the front end they will be presented with a new button along the navigation bar called ‘Analytics’ within here they can access the order statistics like the admin; the key difference here is that they cannot apply a filter, as this is controlled by the master filter in the extension configuration.
Filter
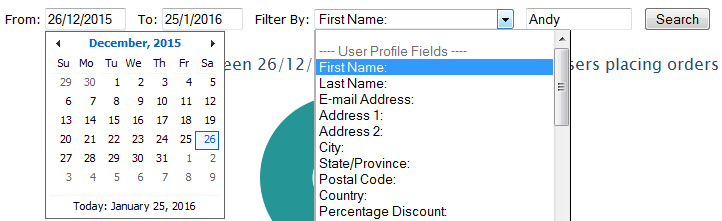
There are 3 tabs on the Order Analytics page: Users, Orders, and Documents. Each tab has a date range and filter that affects the chart and table data. The filter works in a similar manner as the master filter on the user site. Only user profile and payment step fields can be selected along with a value for the field (e.g. User Profile First Name = ‘Andy’ or Payment Cost Centre = ‘Sales’).
Users
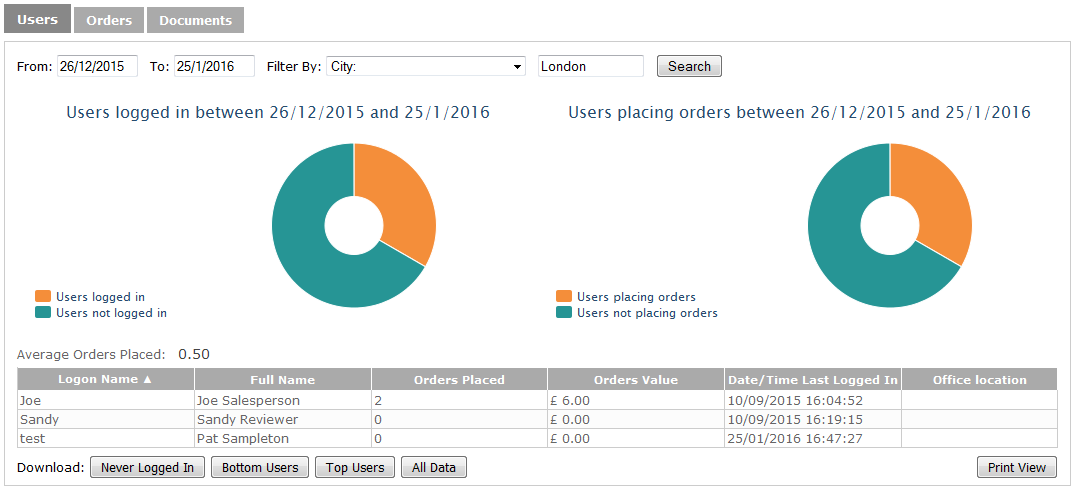
The users tab provides a breakdown of every user on the system, their name, how many orders they have placed and the total cost of these orders, as well as the last time they logged in and a custom field (if configured). All orders, regardless of status are included in the orders placed figure, though pricing won’t include cancelled or rejected items when calculating order values. It is not possible to select custom columns whose names match the default column names (e.g. ‘Full Name’). The output table can be sorted by clicking on the header of any column.
The first pie chart show the number of users who have logged into the system (the “to” date is always overridden to today’s date) and the number of orders placed within the defined date range. The second show the number of users who have placed orders in the selected timeframe (regardless of whether the order was fulfilled).
Underneath the data table, there are buttons that offer the ability to download CSV reports showing user adoption statistics and a printable version of the data table. User adoption statistics are based on the average number of orders placed in the selected period. The calculation of the average number of orders excludes users who have never logged in and is shown above the table.
‘Never Logged In’ - users who never logged in to the system.
‘Bottom Users’ - users who placed less than the average number of orders in the selected period.
‘Top Users’ - users who placed more than the average number of orders in the selected period.
‘All Data’ - all data from the data table.
Templates
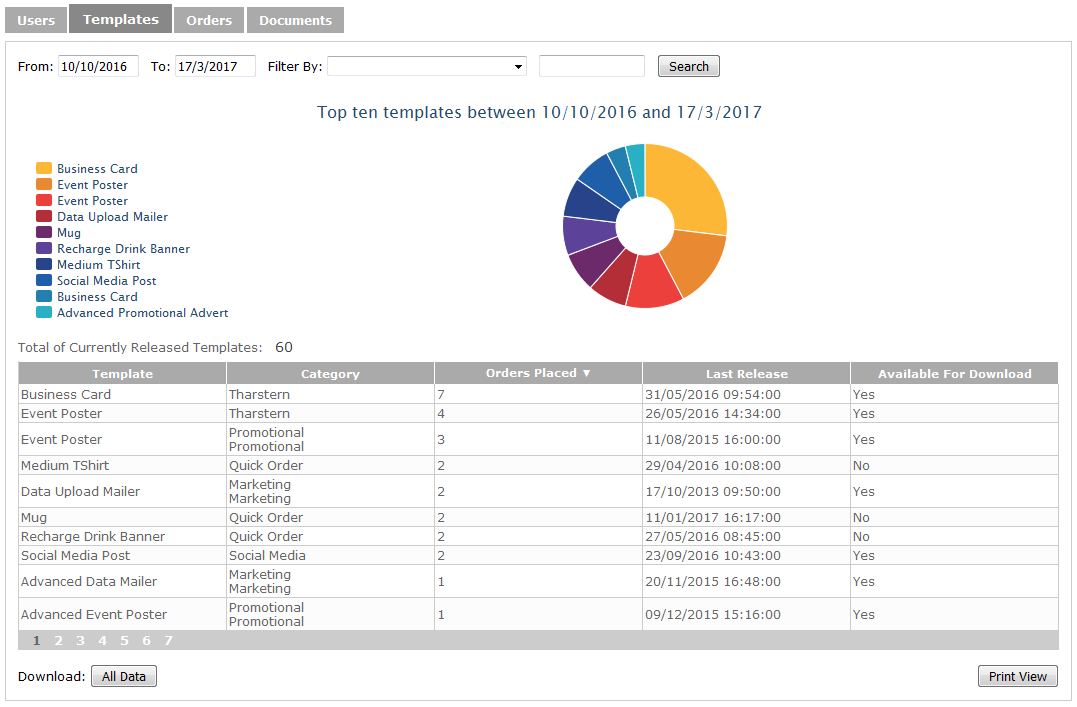
The templates tab provides a breakdown of all live templates on the system: its name, what categories it is in, how many times users placed orders for it, when it was last released, whether it is downloadable and a custom field (if configured). The orders placed column does not include rejected or cancelled documents. It is not possible to select custom columns whose names match the default column names (e.g. Category’). The table can be sorted by clicking on the column headings.
The pie chart shows the 10 most ordered products for the given timeframe (or fewer if less than 10 products were ordered during that period).
There are buttons under the table that offer the ability to download a copy of the data and printable version of the data table. The number of currently released templates is shown above he table.
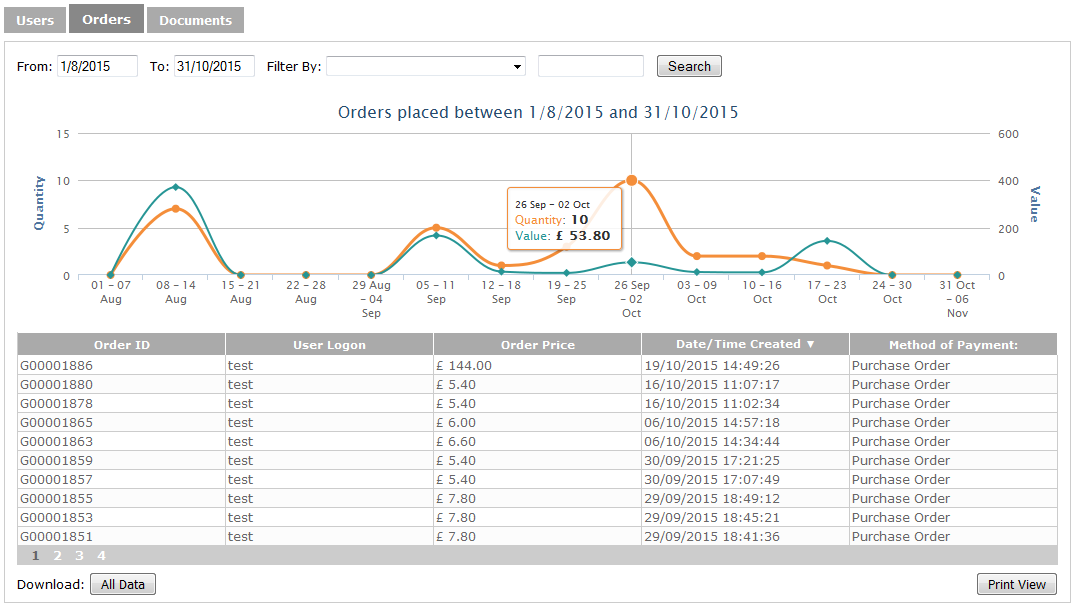
Orders
The orders tab provides a breakdown of every order placed on the system: its ID, user who ordered it, price, date and time created and the custom field (if configured). All orders, regardless of status are shown in the table, though cancelled or rejected items won’t be included when calculating order prices. It is not possible to select custom columns whose names match the default column names (e.g. ‘User Logon’). The output table can be sorted by clicking on the header of any column.
The line graph on this page shows all the orders placed within the date range. The table with the line graph can be printed or downloaded by selecting the buttons below the table.
Documents
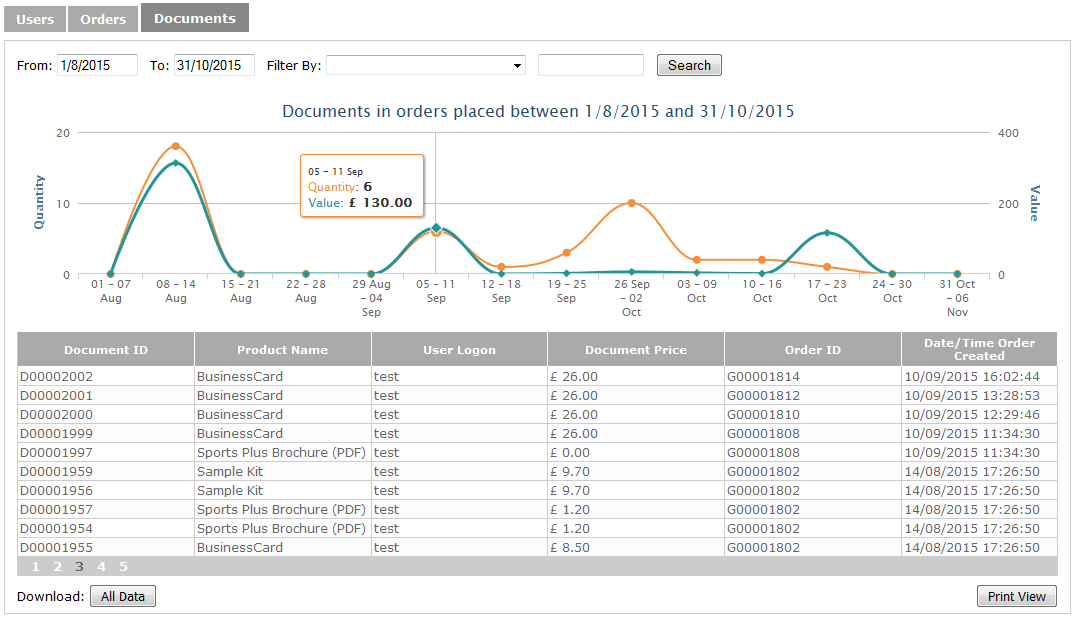
The documents tab provides a breakdown of every ordered item on the system: its ID, user who ordered it, price, corresponding order ID, and the data and time created. Documents that have been rejected or cancelled are not shown in the table. There is no custom column available for this table.
The line graph on this page shows the documentsplaced within the date range. The table with the line graph can be printed or downloaded by selecting the buttons below the table.